Group Partners
Homepage / Development Tools / MULTI IDE

- Eliminate bugs to maximize profit
- Find bugs early
- Easy to adopt, easy to maintain
- Debug complex systems easily
- Simplify debugging in multicore systems
- Capture every bug
- Unparalleled target support & third-party integrations
Develop reliable embedded software in record time.
The MULTI integrated development environment (IDE) leverages over 25 years of embedded software development expertise to give you the tools you need to create reliable software efficiently. With the MULTI IDE you can produce higher-quality products and get them to market faster at a lower development cost.
The MULTI IDE combines a powerful debugger, editor, code browser, configuration manager, and other tools into one integrated package that enables you to develop code efficiently. The MULTI IDE uses Green Hills Software's optimizing C, C++ and EC++ compilers to generate the fastest and smallest code for 32- and 64-bit processors. With MULTI, you can:
- automate adherence to engineering standards
- find performance bottlenecks
- eliminate software flaws to achieve maximum reliability, performance, and security
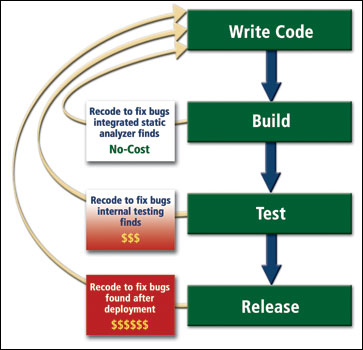
Studies show that 63% of the software development cycle is consumed by finding and fixing software flaws. Bugs in software are the main reason products get to market late because the time required to find and fix them is so unpredictable. Problems such as complex memory errors, resource sharing conflicts, and timing issues make debugging especially troublesome.
Your product's ultimate market share is largely determined by the speed with which you reach volume production. Each difficult bug can monopolize your software development team for days, weeks, or more. Each day a developer is tied up fixing bugs is one less day the product is generating revenue and gaining market share.

Since bugs found early in the development cycle are much less expensive to fix than those found later, DoubleCheck lowers development costs by identifying problems in your code even before running it on your hardware or a simulator. Bugs found late in the development process are at least 10 times more expensive to resolve than those found in the early stages. The most cost-effective time to find and fix flaws is before they even occur. The DoubleCheck integrated static analyzer enables you to effortlessly eliminate flaws in your software before you run your program on your hardware or a simulator.
DoubleCheck checks your code each time you compile. and can find bugs that may never show up during system testing. In fact, these bugs may not have any observable symptom, but rather may be manifested in a security weakness.
DoubleCheck evaluates every possible path your program may take, accounting for interactions that span functions and source files to identify:
- Potential NULL pointer dereferences
- Access beyond an allocated area (e.g. array or dynamically allocated buffer); otherwise known as a buffer overflow
- Potential writes to read-only memory
- Reads of potentially uninitialized objects
- Resource leaks (e.g. memory leaks and file descriptor leaks)
- Use of memory that has already been deallocated
- Out of scope memory usage (e.g. returning the address of an automatic variable from a subroutine)
- Failure to set a return value from a subroutine
- Buffer and array underflows
DoubleCheck is complemented by a suite of run-time error checks that alert you to problems before they occur. Null pointer dereferences, out-of-bounds array accesses, and memory corruption bugs don't always cause your system to fail immediately. With run-time error checking, MULTI halts your program and alerts you to the problem immediately, not at some future time when one of these problems triggers a crash.
Easy to adopt, easy to maintain
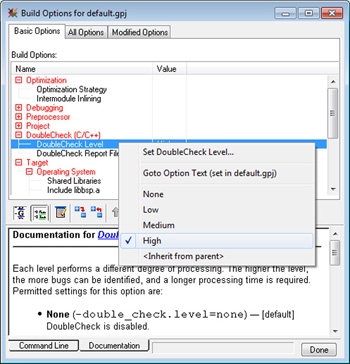
In MULTI, adopting advanced analytsis tools such as MISRA enforcement, DoubleCheck, or Run-Time Error Checking is as simple as setting a build option.
Click here for a larger view
Most development teams understand the benefits of using sophisticated tools, but they can be difficult to include in your build process. All MULTI analysis tools are extremely simple and integrate with your existing workflow.
MISRA enforcement, code complexity limit checking, DoubleCheck, and Run-Time Error Checking can all be enabled very easily through MULTIs Project Manager. Once enabled, these tools work quietly alongside your normal compilation and debugging practices. There are no extra steps to follow and you need not do anything to ensure that the tests continue to run. MULTI will automatically alert you if your program does not adhere to a standard you have elected to enforce or if Run-Time Error Checking finds a flaw.
Debug complex systems easily
Opening MULTI's Cross Reference Browser from the debugger shows every reference for a variable, which references might link to the variable's value, and where the variable is defined and declared. Click here for a larger view.
If you can move through your code more quickly, you can also find the source of bugs more quickly. The MULTI Debugger offers the most powerful capabilities available for quickly flushing out even the nastiest bugs, enabling you to dramatically reduce debugging time. In MULTI, you can:
- click on the name of any procedure to view that procedure's source code in the debugger
- double-click on the name of any symbol to see a complete list of references to that symbol in your program
- use convenient File and Procedure Locator menus to navigate to any piece of source code
If your system is built on a Green Hills Software operating system—INTEGRITY or µ-velOSity™—MULTI provides a comprehensive picture that includes the status of kernel objects, tasks, and resources. Even without source, you can view a complete snapshot of the state of the RTOS and debug its virtual address spaces.
MULTI can also translate the system core dump that INTEGRITY automatically generates when the kernel encounters an INTEGRITY violation. Through MULTI, you can perform complete post-mortem application debugging that includes traversing the stack, using the browse commands, and viewing memory and registers.
Simplify debugging in multicore systems
MULTI's Target List displays components hierarchically, making it easy to see relationships among applications, address spaces, tasks, and threads.
For projects with multiple threads of execution, multiple cores, multiple boards, or any combination of these, the Integrated Target List vastly simplifies the debugging of these complex systems.
In the Target List, all system components are displayed hierarchically, making it easier to see relationships among applications, address spaces, tasks, and threads. Status information is displayed for all components, so you can quickly check the system state. The target list in the debugger allows you to follow application execution from one context to another with a single click. You can watch as different threads interact and sort out complex interdependencies easily.
Capture every bug
TimeMachine's PathAnalyzer tool is a powerful display that makes complex system execution flow easy-to-understand and as a result enables you to find bugs faster. Click here for a larger view.By providing a graphical display of all operating system events, the EventAnalyzer can help in debugging—by tracking down bad interactions as well as in optimization—by quickly showing which operations take the most time. Click here for a larger view.
Every developer hates those intermittent bugs that never reproduce inside a debugging environment. Weeks can be lost in trying to track down the timing problem responsible. Nightmarish bugs like these are easy to capture, locate, and eliminate using the TimeMachine Debugging Suite.
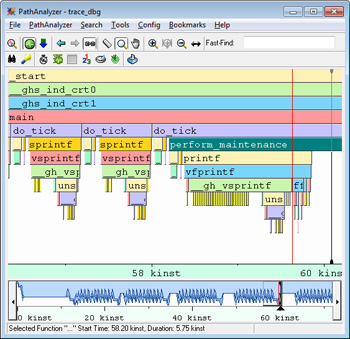
With TimeMachine, developers can readily explore program execution history and, as a result, find and fix bugs faster. The TimeMachine debugger extends standard debugging tools so at any point in the TimeMachine capture you can:
- debug task interactions at the source level
- find specific data points using complex execution and data breakpoints
- examine RTOS data structures
- debug virtual memory applications, such as those in applications running under the INTEGRITY RTOS
The MULTI TimeMachine suite is also performance tuning toolkit. To get the maximum performance from your software applications, the TimeMachine suite enables you to:
- easily measure important system metrics such as interrupt latency, context switch time, and boot time with great accuracy and precision
- perform detailed performance analysis over long periods of time
- quickly debug a performance problem once it's located
Address : Ugur Mumcu St. 43/5 06700 GOP Cankaya, Ankara / TURKEY
Telephone : +90 (312) 447-3016
Fax : +90 (312 ) 447 30 26
E-mail : info@bildesproje.com
Telephone : +90 (312) 447-3016
Fax : +90 (312 ) 447 30 26
E-mail : info@bildesproje.com