Group Partners
Homepage / Development Tools / TimeMachine Debugger
What if you could reverse time?
- Imagine making your program run faster than you ever thought possible. The PathAnalyzer—one component of TimeMachine—provides a unique display of your program's execution history that lets you quickly and easily find previously unknown bottlenecks in your software.
- Imagine undoing a single step in your debugger. Step backward into functions that you've already stepped over, whether intentionally or by accident, to accelerate your debugging.
- Imagine leveraging gigabytes of execution history to verify that your program has been fully tested. TimeMachine integrates with the MULTI Profiler to enable full coverage testing through MULTI's detailed coverage reports.
- Now imagine any other problem. Using TimeMachine's open architecture, you can write custom analysis tools that solve problems unique to the requirements of your software development project.
Produce better code in less time
The MULTI® TimeMachine™ debugging suite offers a wide variety of trace analysis tools that enable embedded software developers to find and fix bugs faster, optimize with ease, and test with confidence. The TimeMachine suite extends the range of Green Hills Software’s popular MULTI integrated development environment (IDE) by providing a window into the complex interactions in software that can result in bugs, performance problems, and testing nightmares. By presenting this information in easy-to-understand displays, TimeMachine enables developers to quickly navigate through trace data and produce better code in less time.
Helpful throughout the development cycle
The MULTI TimeMachine suite offers benefits throughout the development cycle:
- Development proceeds more quickly when using innovative TimeMachine debugging capabilities to help find and fix bugs faster
- Integration flows smoothly when powerful TimeMachine performance analysis tools are put to work uncovering system bottlenecks
- Testing is more thorough when test code is verified using advanced TimeMachine code coverage tools
Fix bugs faster
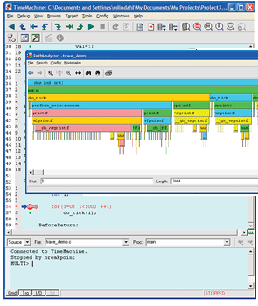
At the heart of the TimeMachine suite, the TimeMachine debugger combines a familiar debugger interface with innovative functions that enable developers to step and run forward and backward through their code. In addition, all standard debugging tools are available, such as execution and data breakpoints. Using these capabilities, developers can more easily track down the root cause of bugs—even if they occurred long before the problem manifested itself. With TimeMachine, developers can more readily explore processor execution and, as a result, find and fix bugs faster.
The TimeMachine debugger also provides functions for:
- Viewing register and memory values at any point in the trace data
- Finding specific trace data points using complex execution and data breakpoints
- Examining RTOS data structures to quickly debug task interaction bugs
- Debugging virtual memory applications, such as those in applications running under the INTEGRITY® RTOS
Besides the TimeMachine debugger, the TimeMachine suite offers tools that make debugging applications faster and more efficient, including:
- PathAnalyzer: By providing a view of an application’s call stack over time, the PathAnalyzer helps identify bugs and inefficiencies in code. With the PathAnalyzer, developers can quickly determine where the code diverts from the expected path as well as track down anomalous bugs caused by events such as unexpected interrupts or other random glitches.
- EventAnalyzer: The TimeMachine suite is integrated with the MULTI EventAnalyzer, which displays a view of operating system events over time. This display helps track down bad interactions such as deadlocks between various tasks that cause undesirable behavior in your system. TimeMachine supports all Green Hills Software operating systems: the INTEGRITY RTOS and the µ-velOSity microkernel.
Optimize with ease
To get the maximum performance from your device software applications, the TimeMachine suite enables you to:
- Easily measure important system metrics such as interrupt latency, context switch time, and boot time with great accuracy and precision
- Perform detailed performance analysis over long periods of time
- Quickly debug a performance problem once it’s located
Along with the PathAnalyzer and EventAnalyzer, the TimeMachine suite integrates the patented MULTI Profiler to offer the following capabilities to help you more easily identify performance problems in embedded code:
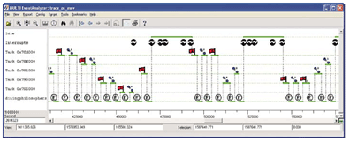
By providing a graphical display of all operating system events, the MULTI EventAnalyzer tool is helpful both during debugging and optimization.
- PathAnalyzer: By making it obvious which functions take the most time, the PathAnalyzer is the ideal tool for pinpointing performance bottlenecks. With its intuitive interface, the PathAnalyzer can offer a unique level of detail to make performance optimization easier and more productive.
- EventAnalyzer: The EventAnalyzer provides a graphical display of operating system events such as kernel service calls, interrupts, exceptions, and context switches. With this information, it’s quickly apparent what operations take the most time and where optimization efforts should be focused.
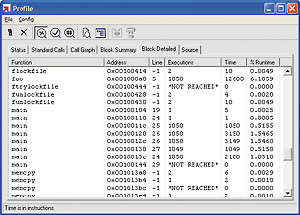
- MULTI Profiler: The integration of the TimeMachine suite with the MULTI Profiler helps to quickly determine how much time an application spends in various places. The MULTI Profiler can create reports with valuable and revealing information about blocks, source lines, and functions to make it easier to find and fix performance problems.
And, since all of these tools are integrated with the TimeMachine debugger, once you’ve located a performance problem, you can easily open the TimeMachine debugger to find the source of the problem.
Test with confidence
The MULTI Profiler tool helps during optimization and testing by providing code coverage reports that show which blocks and source lines have not been executed.
The TimeMachine suite’s powerful code coverage tools allow you to easily determine which particular instructions in the application were executed. This information makes it easy to analyze the quality of your test suite and identify segments of code that have not been thoroughly tested.
- MULTI Profiler: The MULTI Profiler offers code coverage reports that make it easy to determine what blocks and source lines have not been executed. Using this information, you can augment your test suite to include tests that exercise all of your code.
Every software project has unique requirements and TimeMachine's open architecture lets you to write custom tools to meet the demands of even the most complex projects. By leveraging gigabytes of TimeMachine data, you can understand why your system does not always behave as intended no matter what problems you encounter.
The TimeMachine API offers access to raw TimeMachine data that allows you to analyze the execution history of your program in any way you wish. You can fix any bugs you encounter, optimize any performance problems you discover and test your software under any conditions with TimeMachine.
Examples of tools created with the TimeMachine API include C2 code coverage tools, an advanced cache analyzer, and a waveform visualizer. The TimeMachine API has even been used to significantly reduce the power consumption of an embedded consumer device.
Data capture
The trace data analyzed by the TimeMachine Suite can be collected two ways:
- Using a microprocessor that provides a built-in realtime trace port (click here for supported processors)
- Using an instruction set simulator
Collecting trace data is done using Green Hills Software's Supertrace Probe. With the capabilities provided by simulators, virtually any embedded application—not just those using processors with hardware trace capabilities—can take advantage of TimeMachine's powerful debug and analysis tools.
Real-time hardware trace
Microprocessors with built-in, real-time trace ports let you tap in to the full capabilities of TimeMachine and collect trace data on shipping hardware that is running production software without any intrusion, instrumentation, or modification to system behavior. Since the system behaves identically while collecting trace data, the TimeMachine suite can help you track down all bugs as well as measure performance metrics very accurately.
With the Green Hills Software SuperTrace Probe you can collect up to 1 GB of trace data. This large buffer enables you to capture more system behavior and, as a result, more easily track down the root cause of bugs.
Besides the large trace buffer, the SuperTrace Probe has the fastest trace interface available—it can collect data at core clock rates up to 1.2 GHz and trace port speeds over 300 MHz.With the SuperTrace Probe, you can collect data from the fastest trace-enabled processors today and ensure a smooth transition to faster processors in the future.
Green Hills Software simulators
Green Hills Software’s instruction set simulators include full TimeMachine support so that software debugging and analysis can be performed without connecting to target hardware.
With a simulator, software development can begin before target hardware is available. Besides getting a jump on initial code writing, simulators are helpful throughout the development cycle, enabling debugging and testing to continue even when target hardware is in short supply or when there are known hardware bugs that may not have software work-arounds.
The TimeMachine suite also supports ISIM, the INTEGRITY simulator. By combining ISIM—which is optimized to run INTEGRITY applications faster—with the TimeMachine suite, embedded INTEGRITY, velOSity, and µ-velOSity applications can be developed using the most advanced debugging and analysis tools available.
Address : Ugur Mumcu St. 43/5 06700 GOP Cankaya, Ankara / TURKEY
Telephone : +90 (312) 447-3016
Fax : +90 (312 ) 447 30 26
E-mail : info@bildesproje.com
Telephone : +90 (312) 447-3016
Fax : +90 (312 ) 447 30 26
E-mail : info@bildesproje.com